More information

Statistical analyses

More than 170 tests and analyses in 32 groups, all included and named as you will find them in EREUNA.

Before choosing
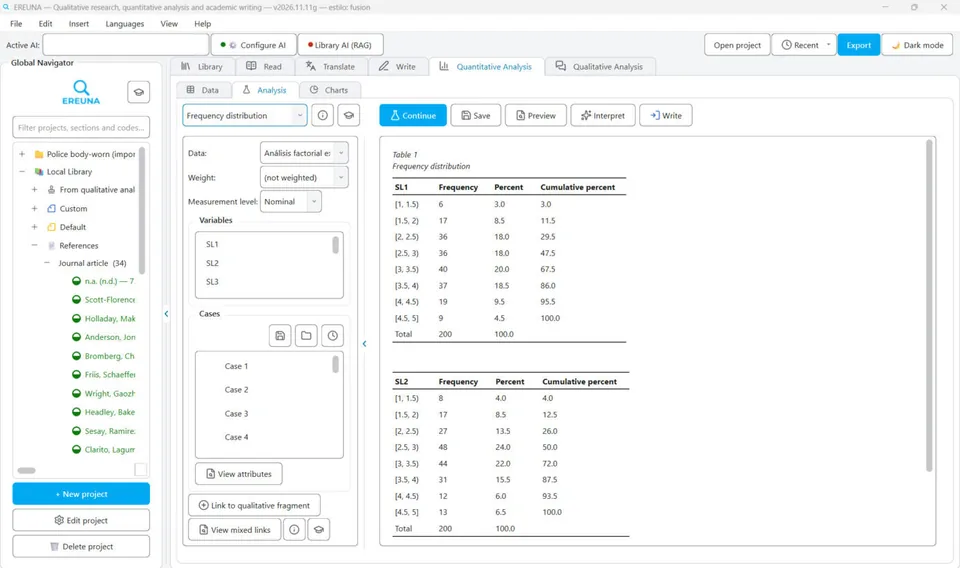
  • Frequency distributionFrequency distribution
  • Multiple responseMultiple-response frequencies · Multiple response by groups
  • Descriptive statisticsMean · Median · Mode · Standard deviation · Variance · Minimum and maximum · Quartiles · Interquartile range · Percentiles · Skewness and kurtosis
  • Contingency tablesChi-square + Cramér's V · Fisher's exact test (2×2 table) · Nominal association (lambda, tau, Cramér's V) · Ordinal association (gamma, tau-b, tau-c, Somers' d) · Mantel-Haenszel (pooled ratio, with Breslow-Day)
  • Assumptions (normality, variances)Shapiro-Wilk · Kolmogorov-Smirnov · Levene's test (homogeneity of variances)
Parametric
  • Compare meansMeans · One-sample t-test · Independent-samples t-test (2 groups) · Paired-samples t-test · Bioequivalence (TOST, 2×2 crossover) · One-way ANOVA + post hoc
  • General linear modelRepeated-measures ANOVA · Two-way ANOVA (factorial) · Mixed ANOVA (group × time) · ANCOVA (analysis of covariance) · Univariate (general linear model) · MANOVA (several dependents at once) · Linear mixed models · Mixed model with repeated measures · Generalized linear mixed models · GEE (generalized estimating equations)
  • Meta-analysisMeta-analysis (fixed and random effects)
  • Causal effectsPropensity score matching (PSM) · Difference-in-differences (DiD) · Two-stage least squares
  • CorrelatePearson correlation · Correlation Matrix · Partial correlation · Point-biserial correlation
  • RegressionSimple regression · Multiple regression · Mediation (Baron & Kenny, Sobel) · Moderation (interaction and simple slopes) · Logistic regression · Multinomial logistic regression · Ordinal regression (proportional odds) · Poisson regression (counts) · Generalized linear models · Regression with optimal scaling (CATREG) · Weight estimation (weighted least squares)
  • LoglinearGeneral loglinear · Logit loglinear · Loglinear model selection
  • ReliabilityAiken's V (content validity) · Content validity ratio (Lawshe) · Cronbach's Alpha · Split-half (Spearman-Brown and Guttman) · Guttman lambda 1 to 6 coefficients · McDonald's omega · Parallel model (goodness-of-fit test) · Strictly parallel model (goodness-of-fit test) · Intraclass correlation (agreement between raters) · Kappa agreement between raters (Cohen/Fleiss) · Kendall's W (concordance between raters ranking) · Comparison of two measurement methods · Item Response Theory (Rasch, 1PL) · Item Response Theory (2PL) · Item Response Theory (3PL) · Graded response model (polytomous IRT) · Differential item functioning (Mantel-Haenszel)
  • Dimension reductionKMO and Bartlett's sphericity · Exploratory factor analysis · Confirmatory factor analysis · Structural equation modeling · Principal components · Correspondence analysis · Multiple correspondence analysis · Categorical principal components (CATPCA) · Metric MDS · Nonmetric MDS (ordinal)
Nonparametric
  • One sample: fit and randomnessBinomial test (one proportion) · Sign test (one sample) · One-sample Wilcoxon (non-parametric) · Runs test · Chi-square goodness of fit · Hardy-Weinberg equilibrium
  • Two independent samplesMann-Whitney U (non-parametric) · Median test (Mood) · Two-sample Kolmogorov-Smirnov
  • Two related samplesWilcoxon (non-parametric) · Sign test (paired samples) · McNemar (pre/post with a yes/no answer) · Marginal homogeneity (two measures, 3+ categories)
  • Three or more samplesKruskal-Wallis (non-parametric) · Median test (Mood) · Jonckheere-Terpstra (ordered groups) · Friedman (non-parametric) · Cochran's Q (3 or more yes/no measures) · Dunn's test (Kruskal-Wallis post-hoc)
Classify or group cases
  • Classification and predictionDecision tree · CHAID decision tree · Nearest neighbors (k-NN) · Discriminant analysis
  • Cluster analysisTwoStep cluster · Hierarchical cluster (dendrogram) · K-means cluster
  • Diagnostic accuracyROC curve and area under the curve · Signal detection theory (d′ and criterion)
Measuring populations
  • Population sizeLincoln-Petersen (two captures) · Schumacher-Eschmeyer (three or more captures)
  • Diversity and similarityDiversity indices · Similarity between two communities
Survival
  • SurvivalSurvival (Kaplan-Meier and log-rank) · Cox regression (proportional hazards) · Weibull regression (accelerated failure time) · Exponential regression (accelerated failure time)
Estimate a quantity
  • Curve and kinetic modelsCurve estimation · Nonlinear regression · Calibration curve (with LOD and LOQ) · Dose-response: LC50 / LD50 · Probit analysis · Michaelis-Menten kinetics · Arrhenius (activation energy)
  • ProbabilityAddition rule (with my dataset) · Probability tree
  • Bayesian statisticsBayesian estimation of a proportion
Quality and outliers
  • Process quality controlControl chart (process stability) · Count chart (p, np, c, u) · Process capability · Pareto of causes · Ishikawa diagram · FMEA (failure mode and effects analysis)
  • Outlier detectionGrubbs' test (one outlier) · Dixon's Q test (3 to 10 data points) · Multivariate outliers (Mahalanobis distance) · Cook's distance (influence on a regression)
  • Missing dataMissing value analysis · Little's MCAR test
Other analyses
  • Demographic analysisAge and sex structure (pyramid and dependency) · Life table and life expectancy · Age standardization of rates (direct and indirect) · Arriaga decomposition (difference in life expectancy) · Fertility (age-specific, general and total rates) · Growth rate and doubling time · Components of population change · Projection by extrapolation · Cohort-component projection · Net migration (cohort survival ratio method) · Years of potential life lost · Index of dissimilarity (Duncan) · Residential segregation · Multigroup entropy (Theil) · Gini coefficient of income · Racial and ethnic diversity · Territory comparison · Whipple, Myers and Bachi indices (quality of reported age)
  • Complex samplesFrequencies · Descriptives · Crosstabs · Ratios · General linear model · Logistic regression · Ordinal regression · Cox regression
  • Surveys and ratesRates and rate ratio · Coverage adjustment
  • Reports and tablesCodebook · Custom tables
  • Forecasting (time series)Autocorrelations (ACF and PACF) · Spectral analysis · Seasonal decomposition · Exponential smoothing · ARIMA model · Expert modeler
Charts
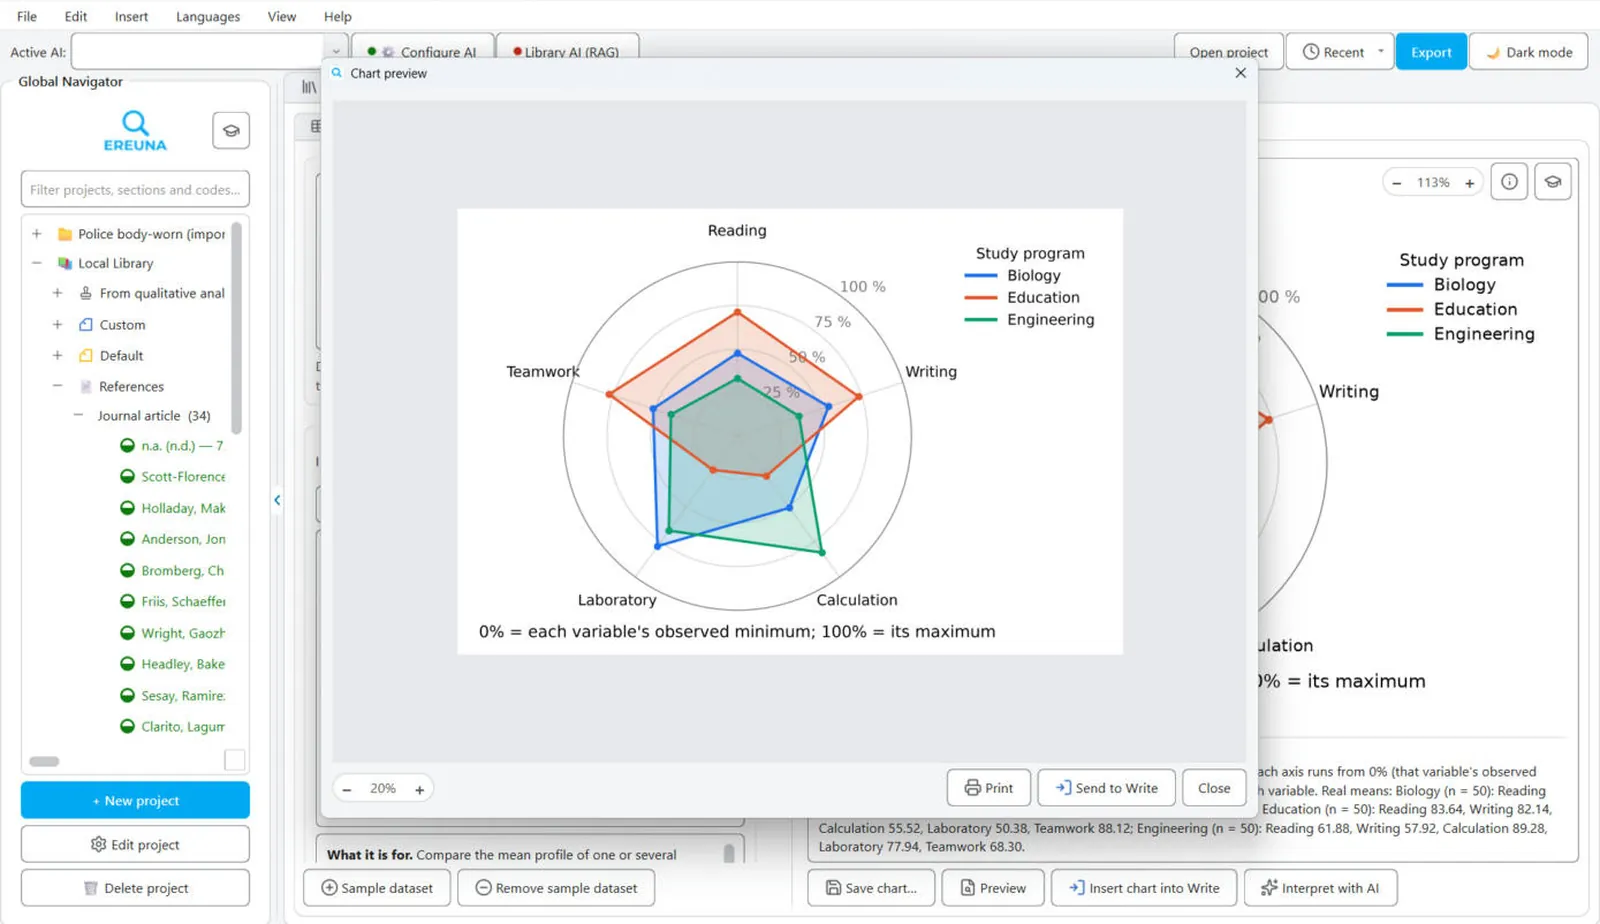
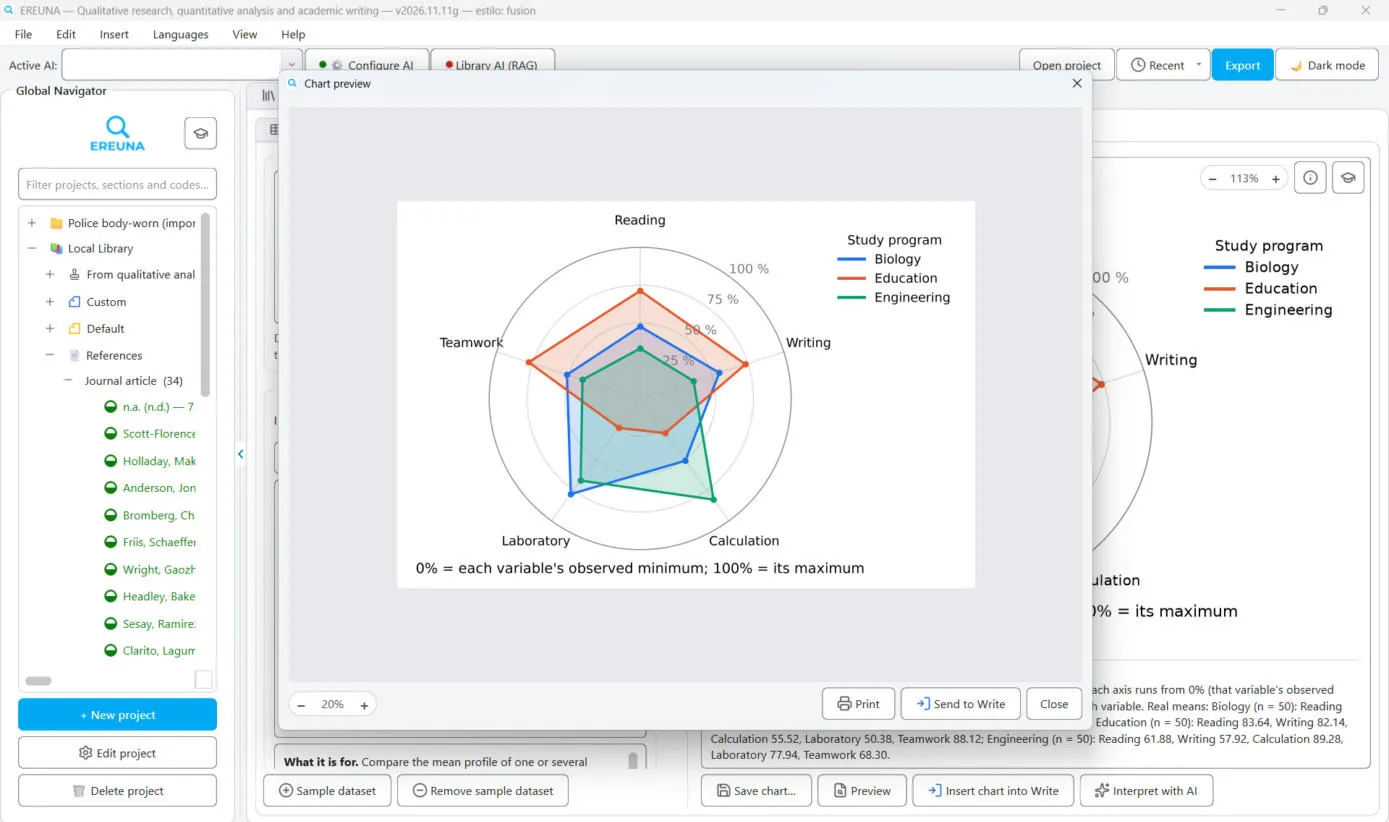
  • Compare categoriesBars (simple, grouped or stacked), Points with interval, Radar chart, Pareto chart, Population pyramid, Polar area (Nightingale rose)
  • See how a variable is distributedHistogram, Density curve, Box plot, Violin plot, Cumulative distribution, Normal Q-Q plot, Raincloud plot
  • Relate variablesScatter plot, Scatter plot with fitted line, Correlation heat map, Scatter-plot matrix, Hexbin (hexagonal bins), Parallel coordinates, Cross-tabulation heat map
  • Parts of a wholePie chart, Donut chart, Half-donut
  • Follow a changeLine chart, Area chart
  • See in three dimensions3D scatter plot, 3D scatter plot with fitted plane, 3D bars of two categories, 3D bivariate histogram, Density surface, 3D pie chart

Qualitative analyses

Go through the tools in the order you use them.

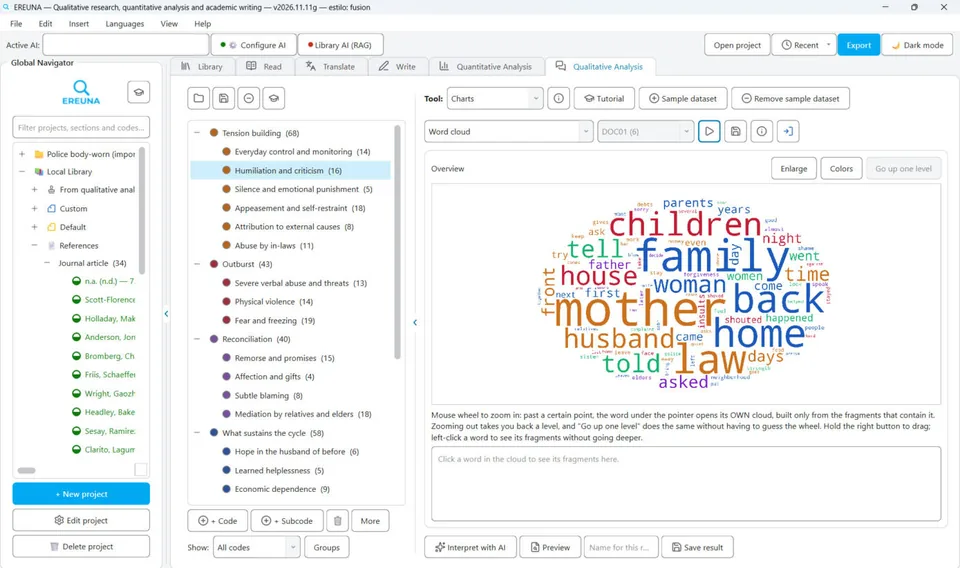
  • 1. CodeFragments, Discover themes (AI), Assisted Coding, Analytic memos
  • 2. ExploreCharts, Text search, Search your library with AI, Framework matrix
  • 3. AnalyzeQueries, Semantic network, Triangulation, Jaccard Matrix
  • 4. See resultsIntercoder
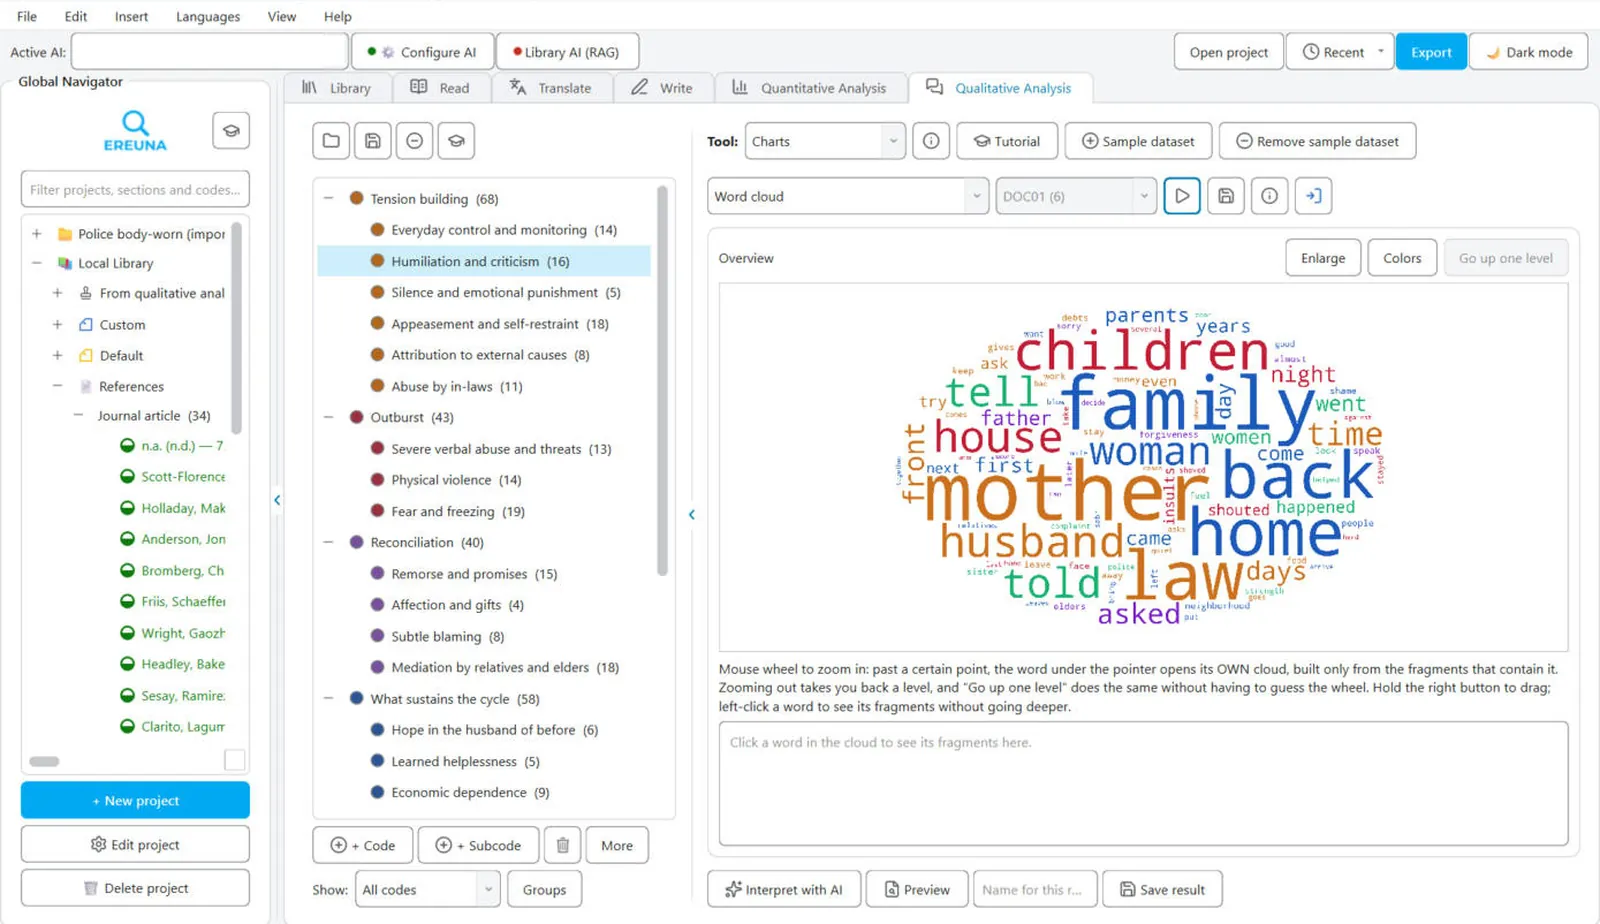
  • ChartsCode frequency, Heat map: which codes appear together, Word cloud, Sequence of codings, Code Pareto, Transition map

Contact

Write to us and a person replies within one to three business days.

support (at) ereunaapp.com

Desktop software for research

All your research in one program, with or without AI

Search the literature, read and cite, translate, analyze qualitative and quantitative data, and write your thesis in one desktop program for Windows. Every citation keeps its link to the document and page it came from.

AI is optional. If you connect it, it works with the documents in your library and you decide what goes into your work.

Coming very soon. From $58 for six months.

  • Windows
  • English and Spanish
  • Your data on your computer
  • 170+ tests included

What research costs across many windows

Research should not mean moving files from one program to another

You know the routine. The articles are in a folder, the citations in a reference manager that does not talk to your draft, and the data in a spreadsheet with three versions. Statistics live in a program whose license expires the semester you need it most. The interviews are somewhere else, and the codes somewhere else again.

When you finally ask an AI chat for help, it hands you a reference that sounds perfect and does not exist. You lose the afternoon checking what it promised to save you.

None of that is research. It is managing tools and spending a lot of money.

EREUNA mostrando un gráfico radial de resultados
One project in EREUNA
Sources and citations

Every citation reaches your document with its source and page.

Data

More than 170 statistical tests included, with APA tables and no modules to buy.

Interviews

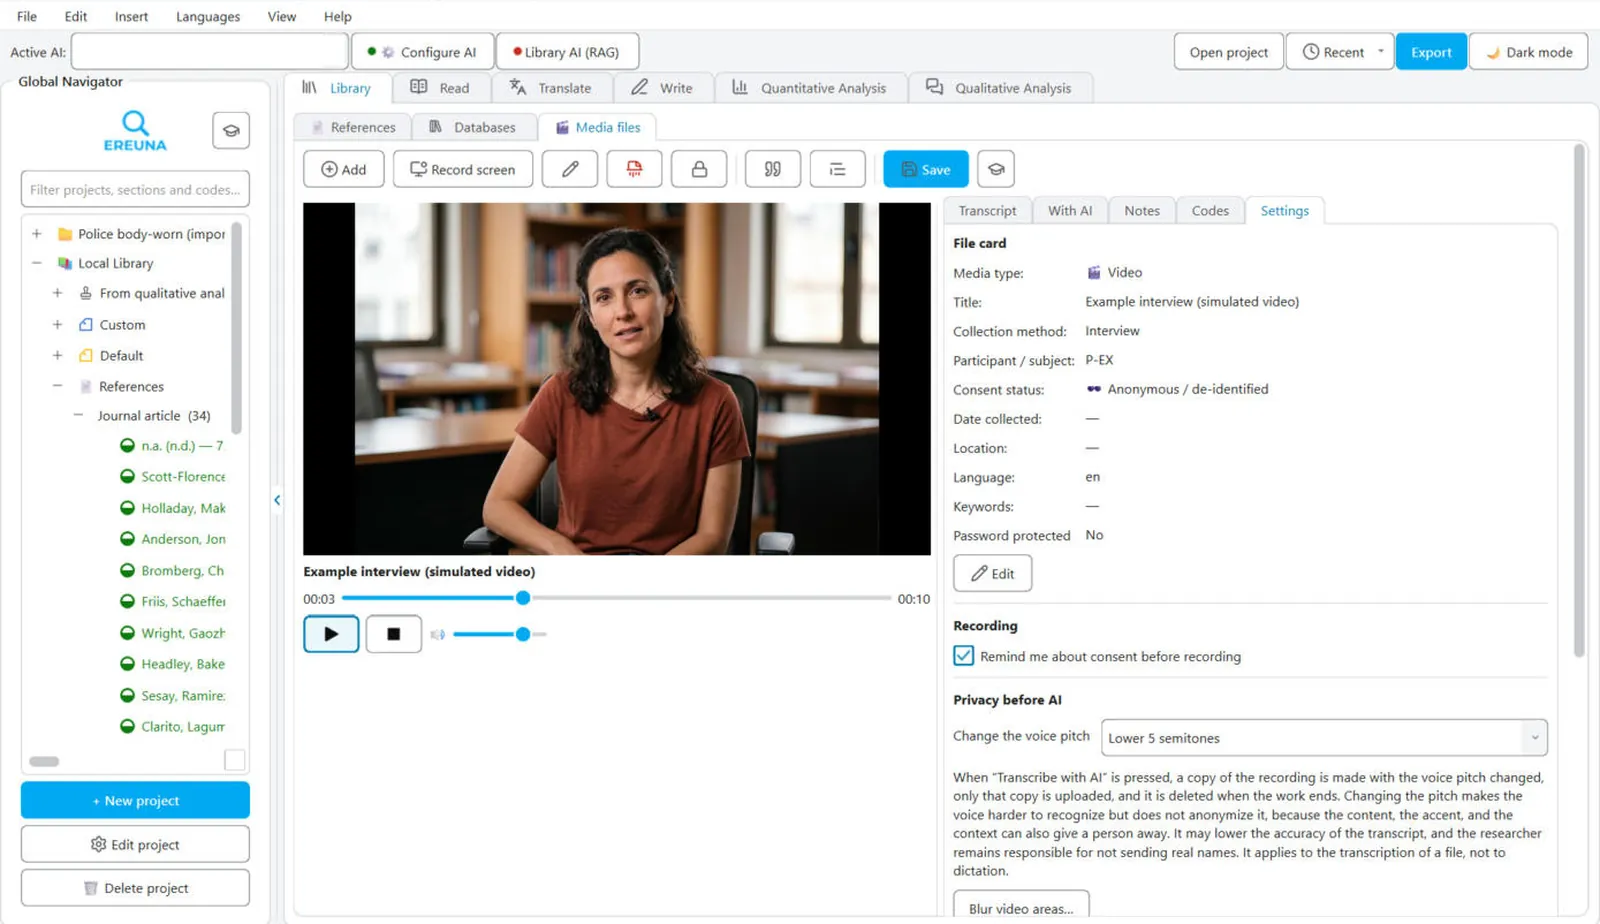
Recordings and transcripts protected with a password, next to your codes.

AI

If you use it, it works with your library and you check every result against the original.

EREUNA brings that work together in one project and gives you back the time to do research.

See the plans

Six connected tabs

One project, from the first search to the last citation

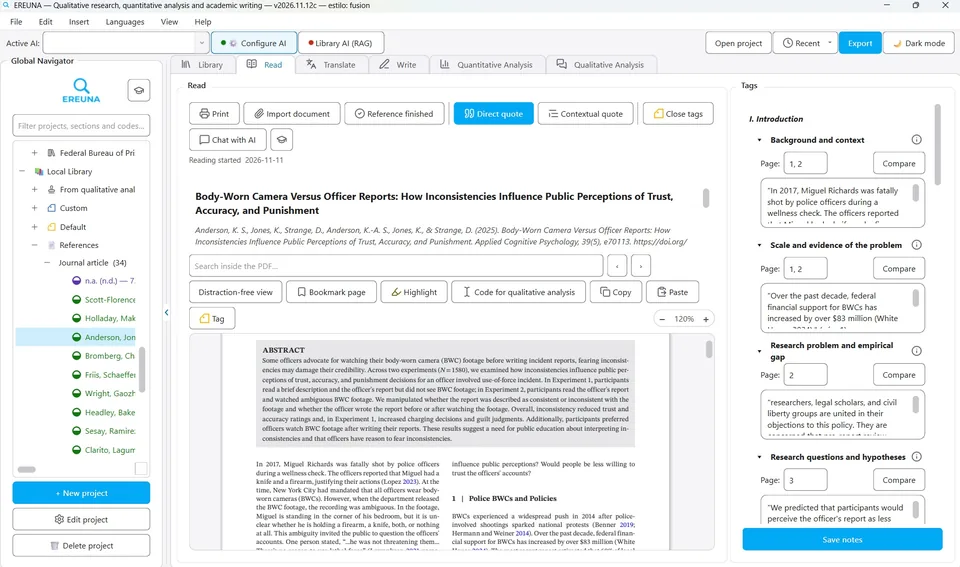
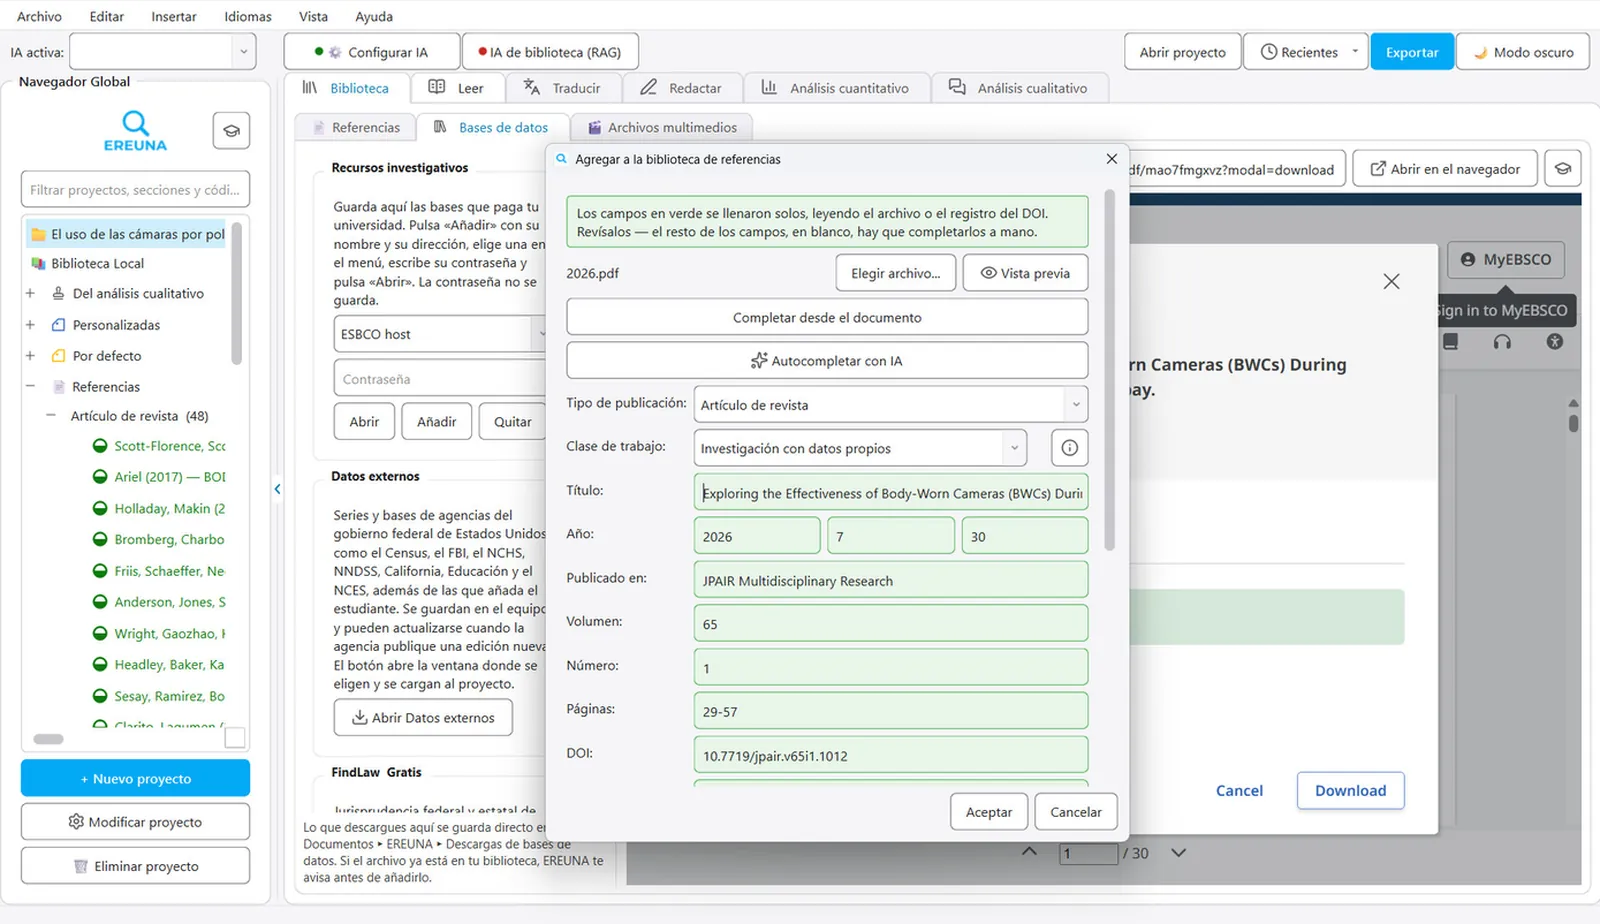
Library, Read, Translate, Write, Quantitative Analysis and Qualitative Analysis all work on the same library. What you read, translate and code reaches your document with its source.

Library

Find, gather and protect your sources and your field data.

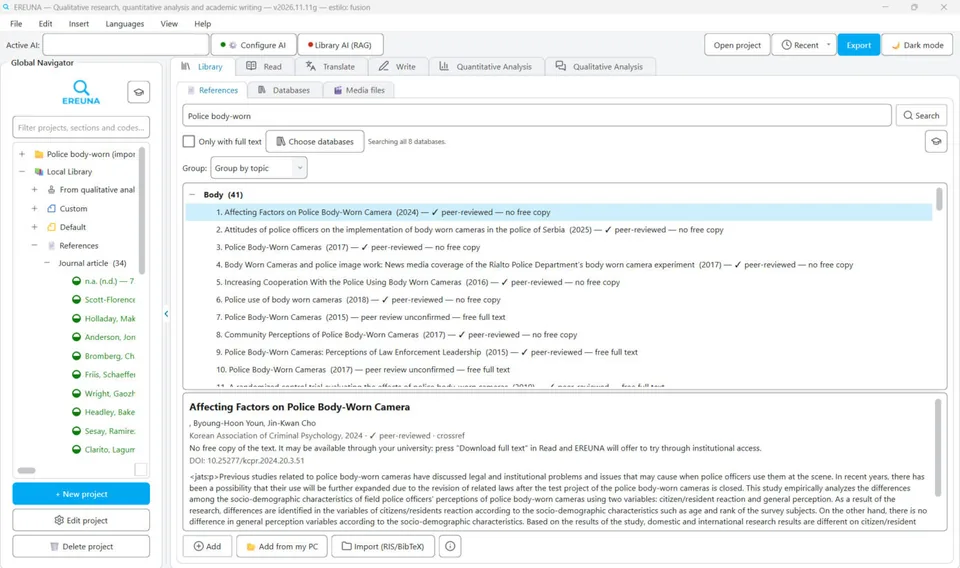
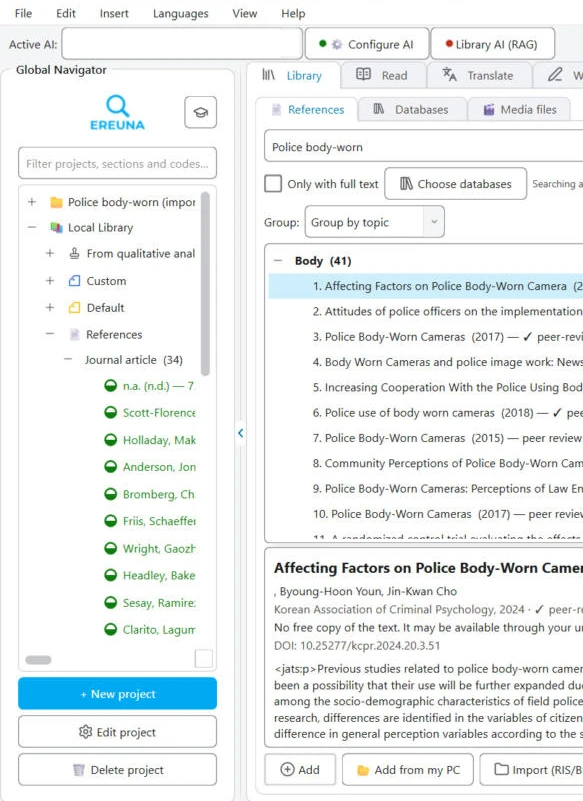
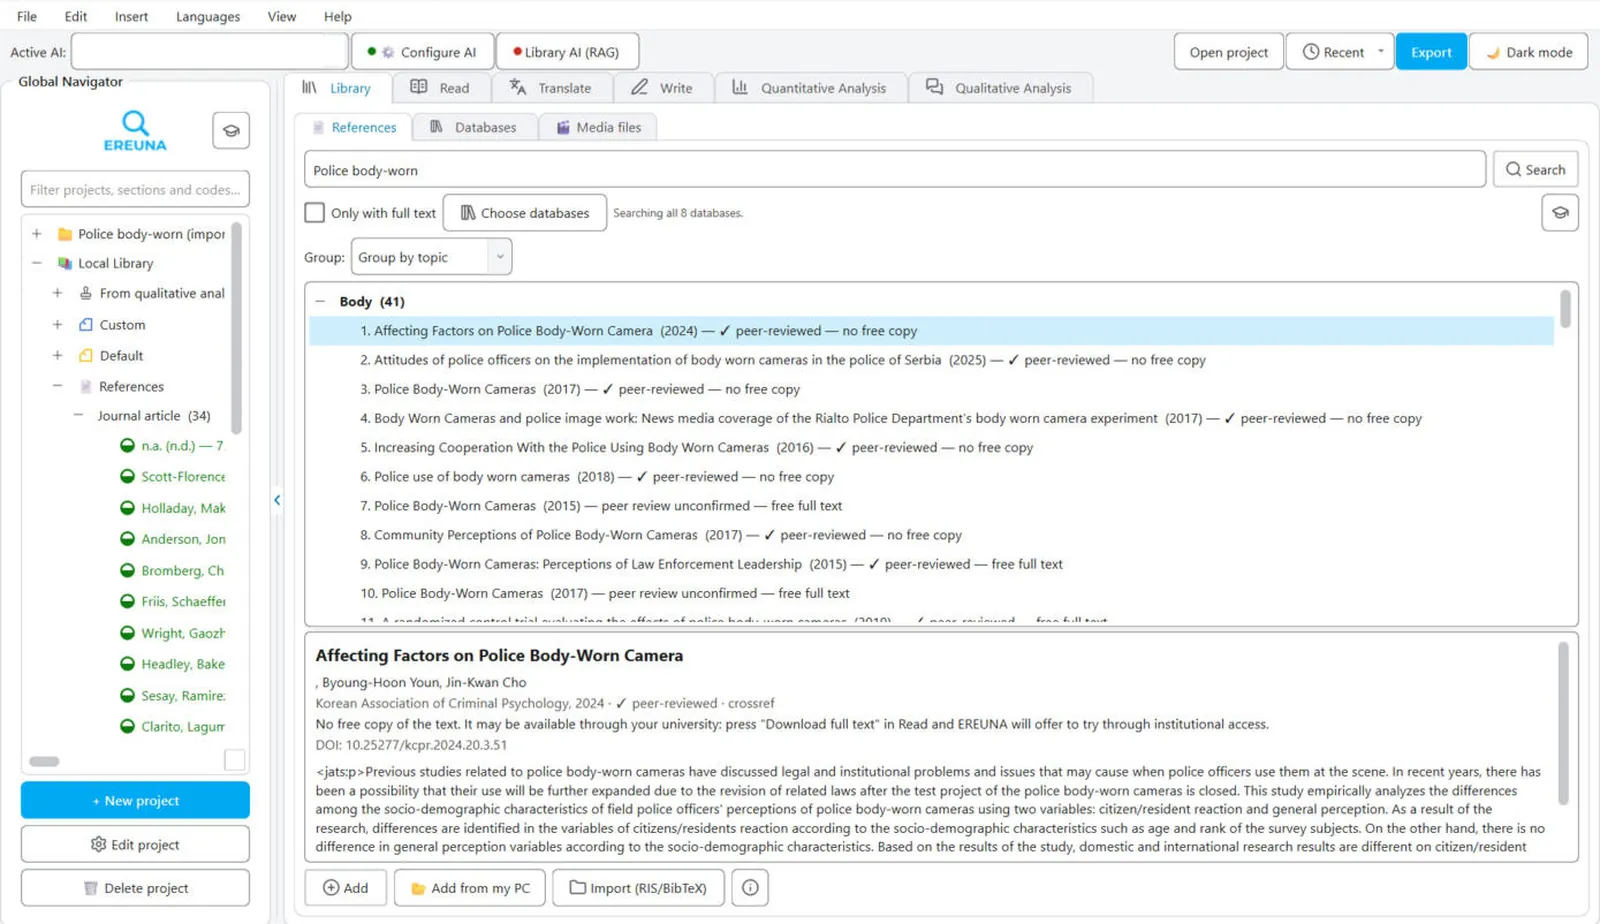
  • ReferencesSearch peer-reviewed literature and add your sources.
  • DatabasesAccess the databases of your workplace or academic institution, and public data from federal and state agencies (configurable and compatible).
  • Media filesStore interviews, videos and recordings with their record and consent, with tools to blur images and change voices. Because privacy matters, every file is password-protected and, when you no longer need it, EREUNA removes it with a secure deletion.

Read

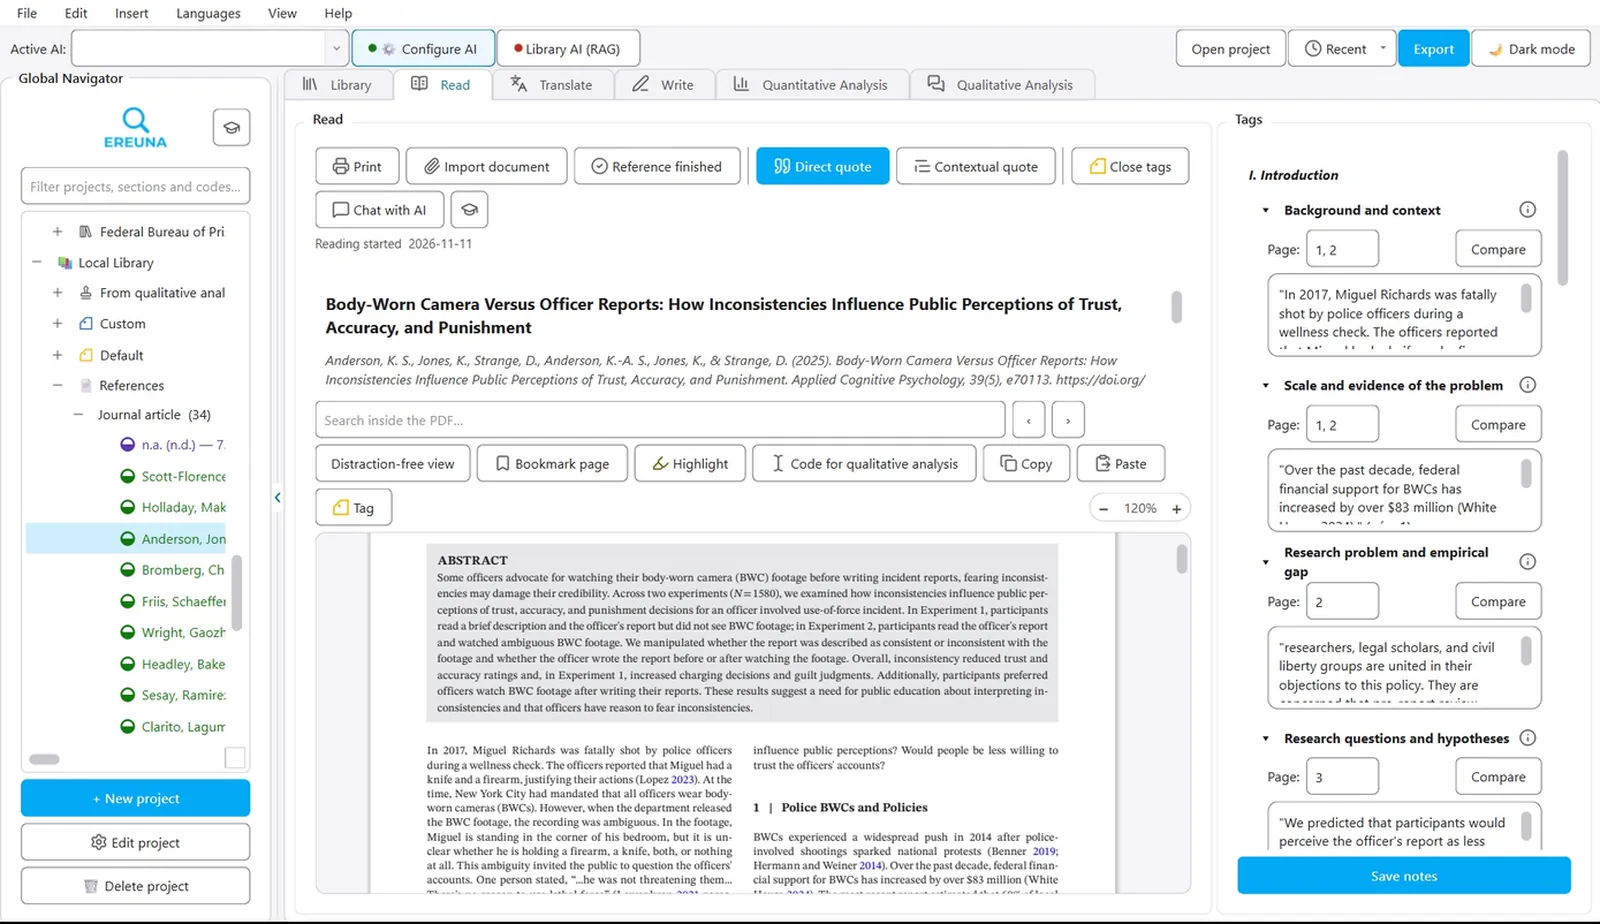
With or without AI support, study your full sources and keep what matters from each one.

  • ReaderRead your full sources, mark where you left off and highlight the text you consider important.
  • QuotesExtract direct and contextual quotes with their page.
  • TagsOrganize your notes by the sections of your work.
  • AI supportIf you wish, it assists you with readings, citations and tags, and also with writing, without taking away your responsibility for your work.

Translate

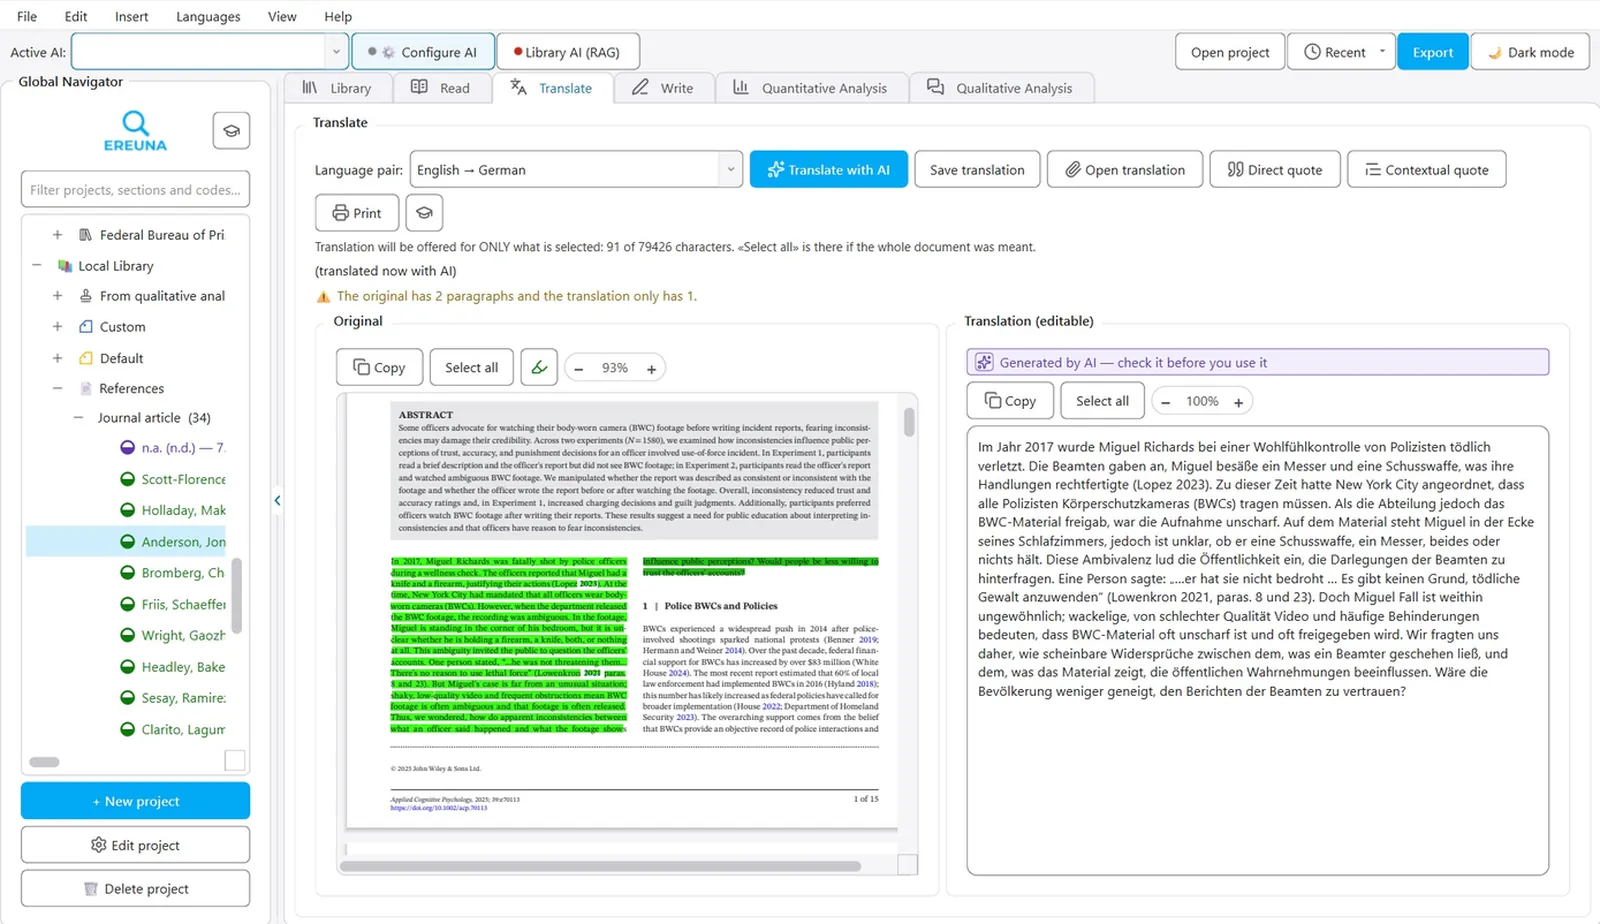
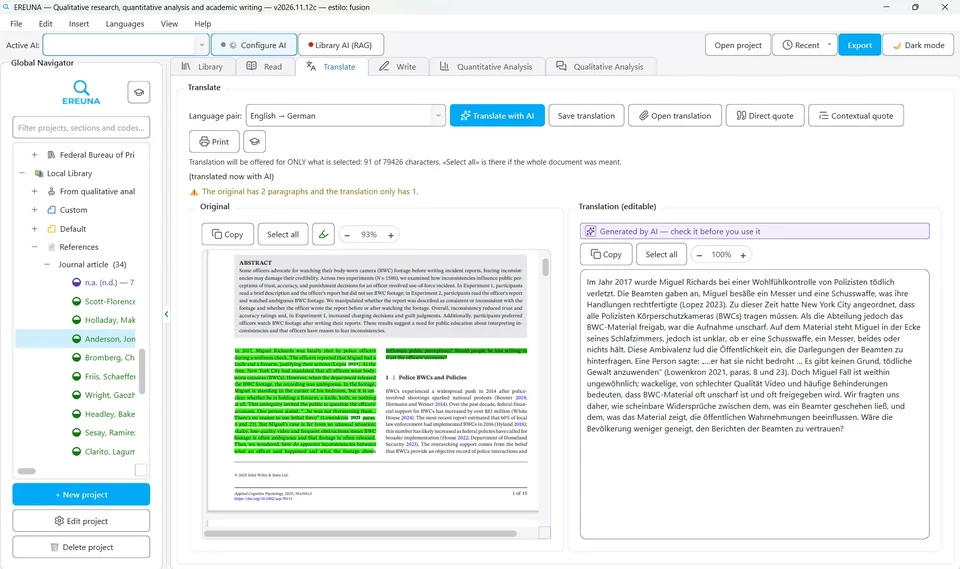
With or without AI support, work with literature in other languages without leaving your project, at a relatively high quality.

  • AI supportTranslate a passage or the whole document.
  • Editable translationReview each proposal and decide whether to apply it.
  • Saved translationsReturn to them and cite them when you need them.

Write

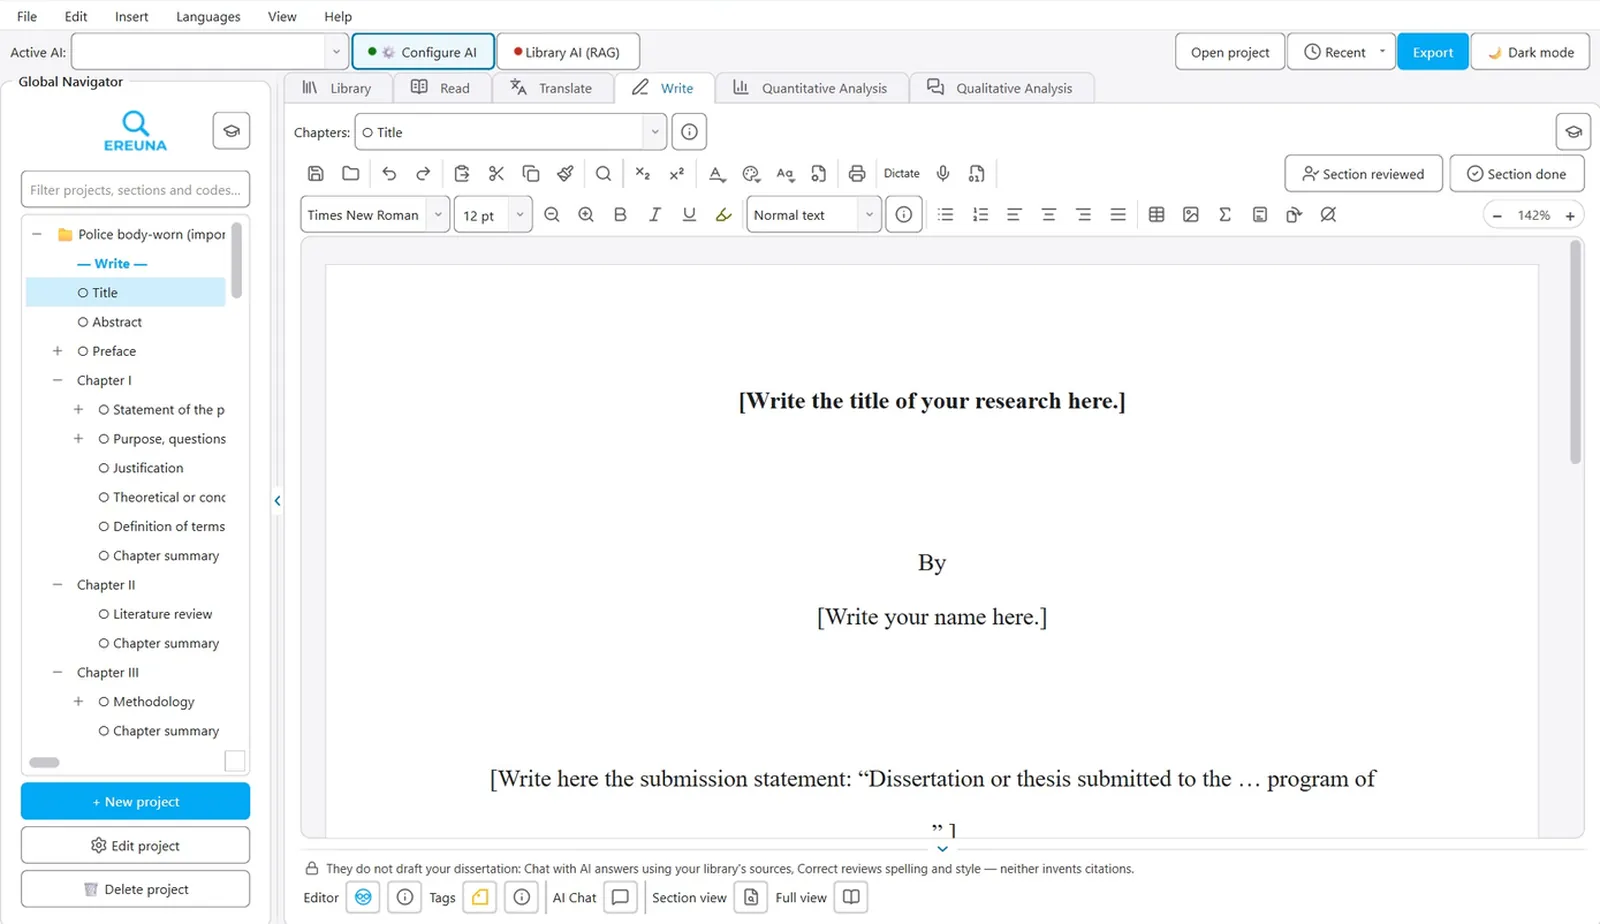
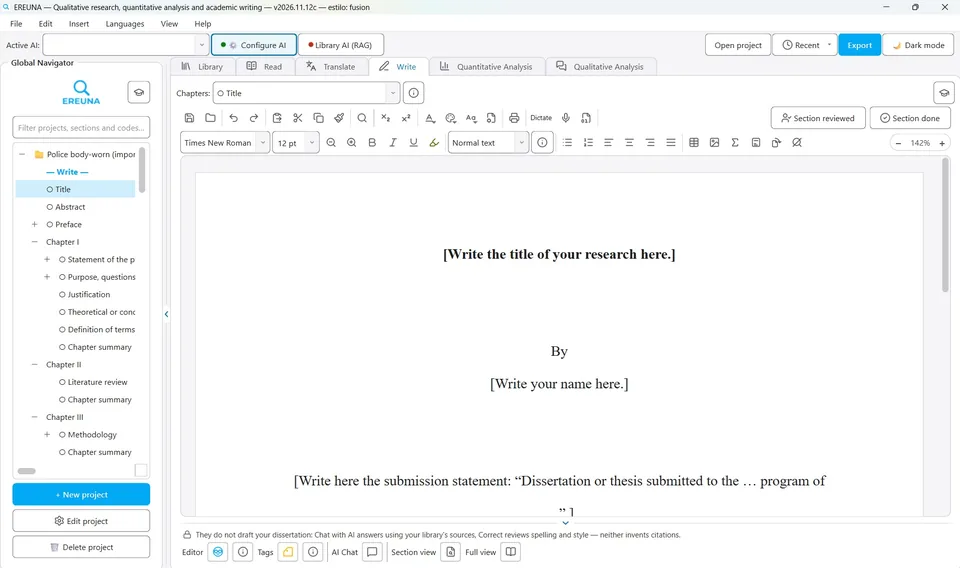
Write within an academic structure and track the progress of each part.

  • Chapters and sectionsAn academic structure ready to write in.
  • Content guidesWhat to include and which questions to answer in each part.
  • Writing toolsSpell checking in English and Spanish, and voice dictation.
  • Review and statusMark each section as reviewed or done.
  • AI supportIt helps you organize everything extracted into tags and write each chapter, respecting your control over the process.

Quantitative Analysis

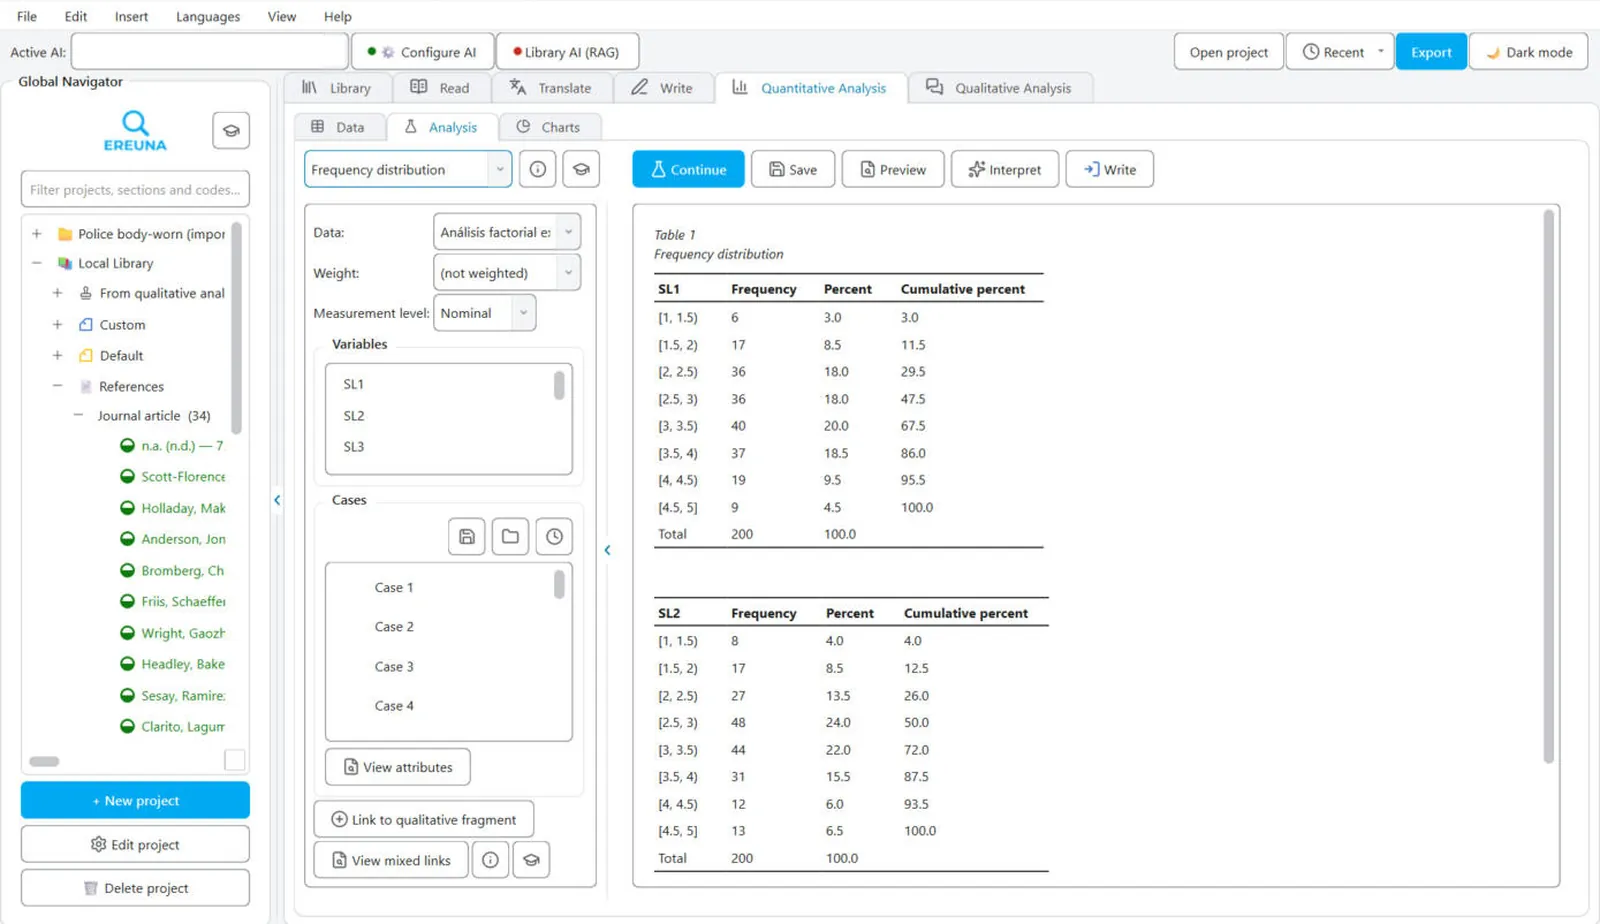
From the dataset to a result ready for your chapter.

  • DataCreate or import your dataset, compatible with Excel and SPSS.
  • AnalysisFrom descriptive analysis to high-level tests and models, in APA format. Everything is included: you pay no extra licenses for new analyses.
  • ChartsPresent your results with high-quality, configurable charts.
  • AI supportIt helps you interpret your data, even if you have little knowledge of statistics.

Qualitative Analysis

From fragment to finding, traceable at every step.

  • CodeFragments, AI-discovered themes, assisted coding and analytic memos.
  • ExploreCharts, text search, AI search of your library and framework matrix.
  • AnalyzeQueries, semantic network, triangulation, Jaccard matrix and intercoder agreement.

AI with judgment

With EREUNA, you lead your research. AI supports you and does not think for you.

EREUNA is not just another AI service. It is a desktop research program that works on its own, with its native tools, and does not need AI to do research. EREUNA is designed as a system that can become hybrid: if you want to work with one of the AI services on the market (API, MCP, RAG), it builds the missing bridge to integrate them with human intellect.

EREUNA translation proposal marked as AI-generated, with the Reject and Apply buttons
Every automatic result arrives marked as such. You review it and decide whether to apply it or reject it.

Complete studies, not summaries

EREUNA works with complete studies, not their abstracts. Nor does it write essays detached from your research design. It accompanies every stage of the process, from the problem statement to the conclusions.

Your judgment, with the support you need

EREUNA offers different levels of assistance, depending on your knowledge. You can work without automatic help or rely on it at every stage.

You decide how and when to use AI

EREUNA has the technology to connect with the AI services you prefer and to let you define how far they go. AI can consult only your documents and take on mechanical writing, calculation and coding tasks, while you focus on thinking.

Sources you have access to

EREUNA works with the documents you obtain legitimately through your workplace or the university where you are a researcher or student. It does not take other people’s content from the internet and present it as yours.

Every quote, with its original

Every citation keeps its link to the document it comes from and to its page. You can open the original at any time and confirm where each idea came from.

Audit without AI

Before accepting any assistance, you compare it with the original document using EREUNA tools that do not use artificial intelligence. That way you catch AI errors before accepting them.

Pricing

One program. One price.

Compare what EREUNA costs with the programs people buy separately today for qualitative analysis, statistics, and reference management.

Swipe the table sideways to see all the programs

Price comparison of EREUNA with NVivo, ATLAS.ti, MAXQDA, SPSS Statistics, and EndNote (USD)
CategoryEREUNANVivoATLAS.tiMAXQDASPSS StatisticsEndNote
Student$79/year$130/year$130/year$105/yearAnalytics Pro: $121$58/yearGrad Pack Base · Premium: $89$150one-time payment
Academic$199/year$520/year$387/year$278/yearAnalytics Pro: $317$1,308/yearBase$275one-time payment
Academic with advanced statisticsIncludeden $199/yearNot applicableNot applicable$317/yearAnalytics Pro$2,352/yearBase + Advanced StatisticsNot applicable
Academic with artificial intelligence$199/yearplus what you pay the AI service you choose$770/yearAI Cloud plan$387/year$410/year$278 + AI Assist Premium $132$1,308/year$275one-time payment
Government and nonprofitContact usContact us$498/year$342/yearAnalytics Pro: $405$1,308/year$275one-time payment
Professional or commercial$449/year$1,005/year$722/year$633/yearAnalytics Pro: $759$1,308/year$275one-time payment
Department (10 or more licenses)$120per license per yearQuoteQuoteQuoteQuoteQuote
Whole campusQuoteQuoteQuoteQuoteQuoteQuote

Prices in US dollars, before taxes, from each vendor's official store as of November 11, 2026. SPSS Statistics is billed monthly ($109 for the Base license and $87 for each add-on module), shown here as its annual equivalent. The SPSS student price is the Grad Pack sold by IBM-authorized resellers. EndNote is sold as a one-time purchase and new versions are paid separately. The AI service you connect to EREUNA is paid separately to its provider. Third-party prices may change without notice.

Features

Everything your research needs, in one place

EREUNA brings together in one program what is spread across several today, with no add-on modules or extra licenses.

Swipe the table sideways to see all the programs

Feature comparison of EREUNA with NVivo, ATLAS.ti, MAXQDA, SPSS Statistics, and EndNote
FeatureEREUNANVivoATLAS.tiMAXQDASPSS StatisticsEndNote
Qualitative Analysis✓✓✓✓✗✗
Descriptive to advanced statistics✓all tests included✗✗Analytics Pro onlyAdvanced with paid modules✗
Reference and citation manager✓Separate product (Citavi)✗✗✗✓
Every citation linked to its original source✓✓✓✓✗✓
Access and download studies from your academic institution’s databases, directly with your researcher, professor, or student password✓AI Cloud only——✗✓Web of Science
Search inside PDFs and documents✓✓✓✓✗✓
Audio and video transcription✓includedAdd-on$499/yearAdd-onpay per useHourly packages✗✗
Media catalog protected with a password✓———✗✗
Artificial intelligenceOptionalyou pay the provider only for what you useAI Cloud only✓Basic freePaid Premium✓✓
Fully works without artificial intelligence✓✓✓✓✓✓
Built-in spell checker and translator✓———✗Translator only
Cloud team collaboration✗Add-on$99/year✓TeamCloud$220/year✗✓
Spanish interface✓✓✓✓✓✓
New analyses without buying extra licenses✓✗✓✗✗New versions are paid

✓ Included✗ Not includedAmber text Available at extra cost or with limits— Not stated on the vendor’s official page

NVivo, ATLAS.ti, MAXQDA, SPSS Statistics, and EndNote are trademarks of their respective owners. Third-party information comes from their official pages as checked on November 11, 2026.
Do the math with what you already pay.

See the plans

Plans

Choose your license

Every license includes the full program. EREUNA launches very soon. Write to us and we will let you know on launch day.

Student

For your thesis, your courses, and your research projects.

$58for 6 months

$79per year

Designed for your thesis semester.

A full year of research.

Notify me Notify me

Recommended

Academic

For professors and researchers. Includes advanced statistics and optional AI with the provider you choose.

Annual renewal

$199per year

For your teaching and your publications.

Up to 2 computers per license

Notify me

Professional

For consultants, companies, and commercial work.

Annual renewal

$449per year

Commercial use included.

Up to 3 computers per license

Notify me

Department

From 10 licenses, for teams in a faculty or research center.

Annual renewal

$120per license per year

One invoice for your team.

Notify me

Every license includes qualitative analysis, descriptive to advanced statistics, the reference manager and new analyses, with no add-on modules.

  • Full refund within 14 days
  • Annual renewal you can cancel anytime
  • One license per computer
  • Updates included while your license is active
  • Your projects stay open for reference if your license expires

Government and nonprofit organizations: ask for pricing. Campus-wide: request a quote. Prices in US dollars. Taxes for your country are calculated at checkout. EREUNA runs on 64-bit Windows 10 and 11.

EREUNA launches very soon

Write to us and we will let you know on launch day. Nothing to pay now.

Your next research project can start organized

One program to read, cite, analyze and write, with or without AI.

See the plans